Management
Event Management
Features
- Add advanced custom filters.
- View Number of events per second
- View Event chart by timeline
- Total events in a time period
- Star Event
- Mark as read
- Add event to favorites
- Show/hide columns in table
- Save search profile
- Select minimum level
- Filter by keyword Noise reduction
- Filter by sensor tag, agent tag
- Only show unread events
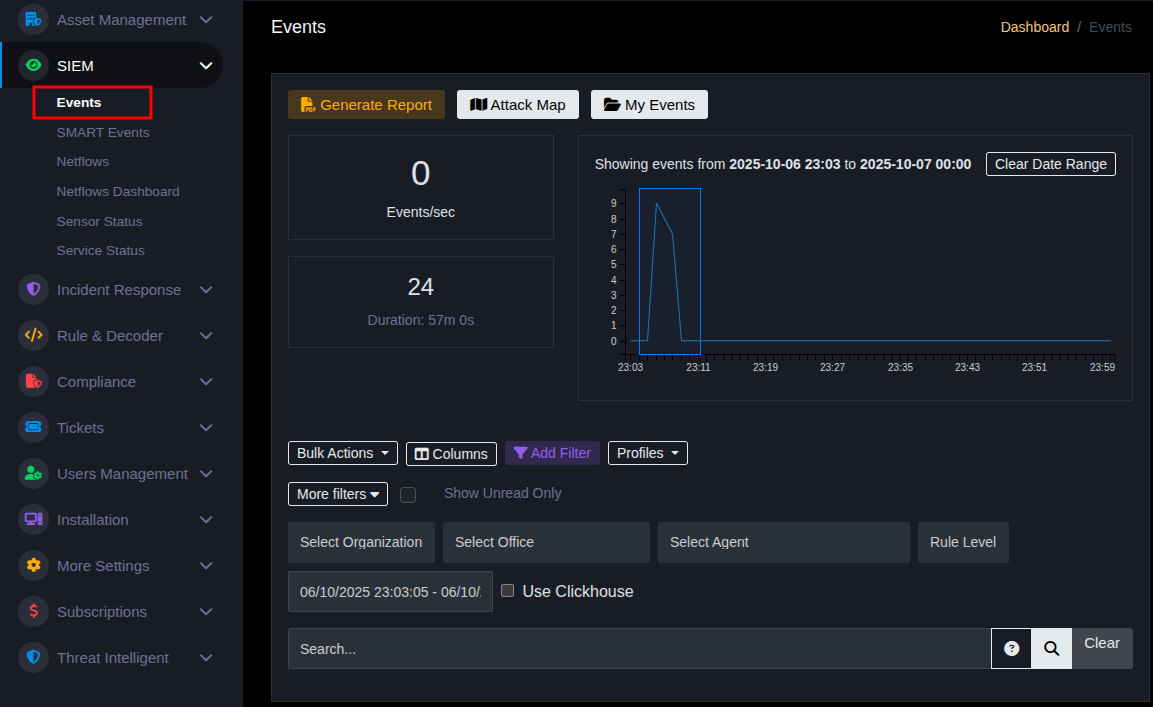
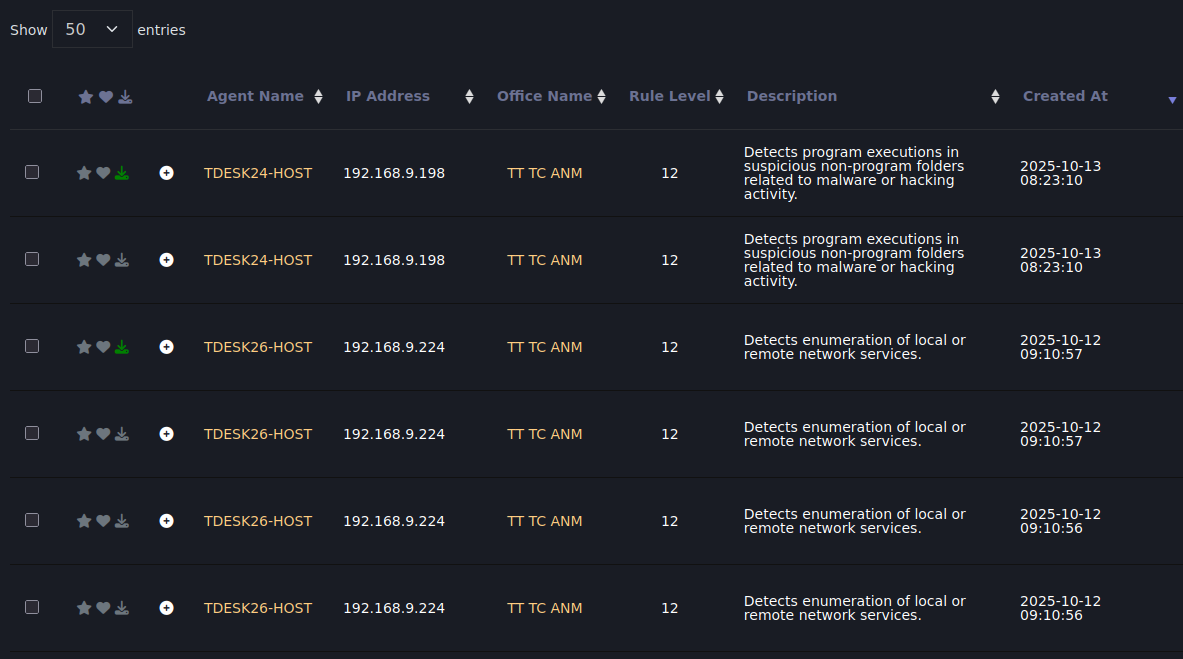
By default, when entering this section the system only displays Events with Rule level 10 and above.
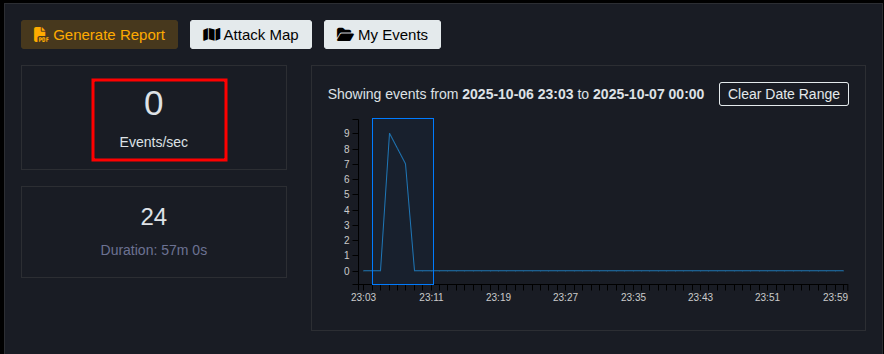
Event count per second statistics
The system will automatically check and display in real-time the number of events generated each second. This feature helps monitor the log generation rate of the entire system in real-time.
- Helps quickly identify anomalies when event volume spikes (sign of attack or system error).
- Supports assessing monitoring system load, avoiding overload or log congestion.
- Increases proactivity in real-time monitoring, helping Tier 1 react early to incidents.
- Provides visual indicators supporting analysis of log generation trends in real-time.
Total events in a time period
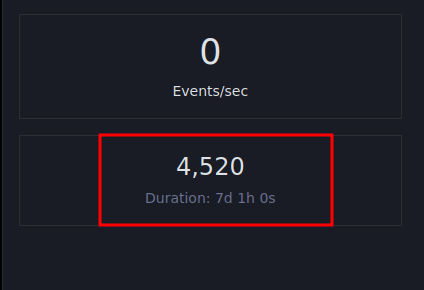
This area by default displays the total number of events in the last 7 days.
When users filter by custom time period, the system will automatically display the total number of events corresponding to the selected time period.
- Helps assess log volume generated in a specific period, serving comparison between weeks or days.
- Supports identifying system activity trends, recognizing periods with high event density.
- Provides quick indicators about stability status of the monitoring environment.
- Helps Tier 1 make overall assessment about event volatility over time.
View Event chart by timeline
The chart displays number of events over time periods (minutes, hours, days...) helping users get an overall and visual view of event generation levels in each period.
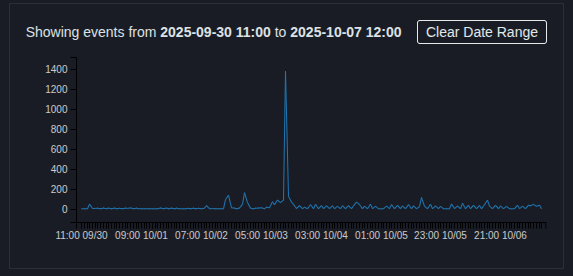
Users can interact directly with the chart — by holding and dragging to create a selection area (zoom) — to enlarge and view event count details in the desired time period.
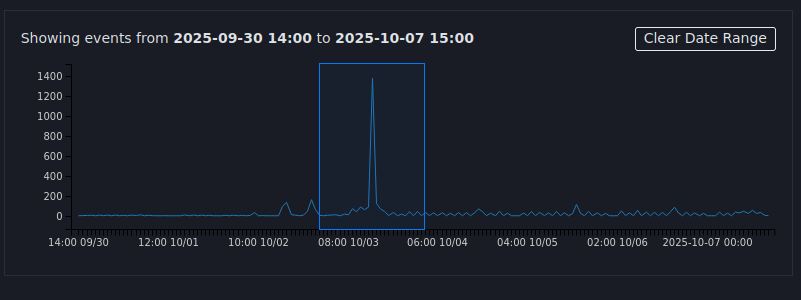
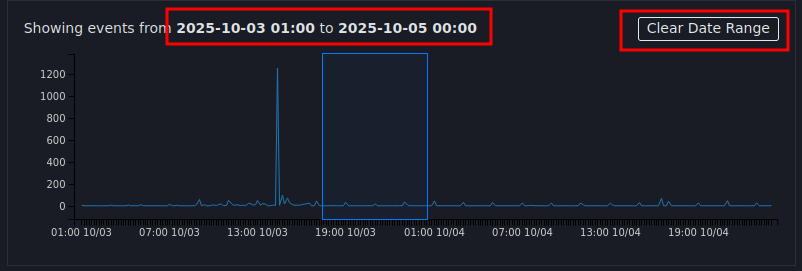
Chart results will update metrics and timeline according to the selection area above
If you want to return to default, press the Clear Date Range button as shown below
- Helps quickly identify abnormal event fluctuations in each time frame.
- Supports detailed analysis of events at suspicious moments or peak periods.
- Improves real-time monitoring and investigation efficiency, allowing quick scope narrowing.
- Enhances log data visualization capability, helping Tier 1 easily track system activity trends.
Star Event
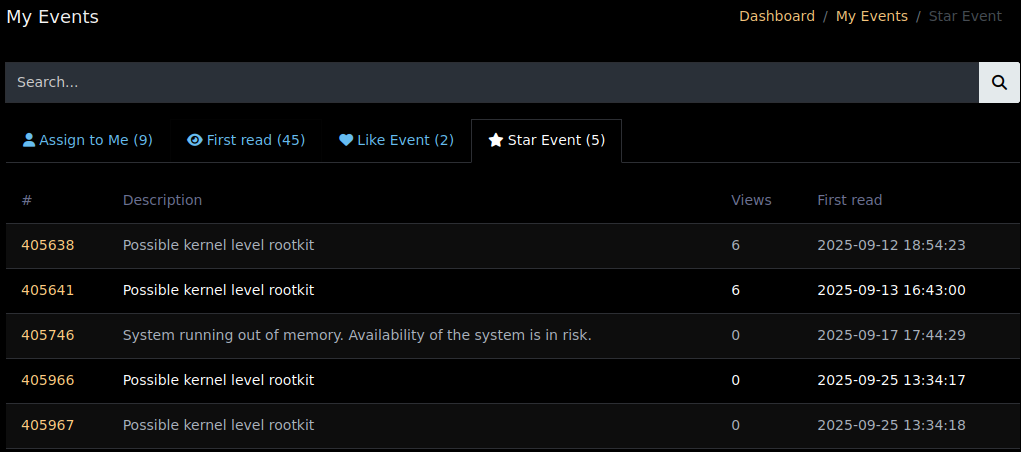
This is a feature to star an event. After being starred for the first time, that event will be marked as Unread and saved in Star Event in My Events
- Helps Tier 1 quickly mark important events that need review or follow-up later.
- Creates a list of notable events, helping not miss important alerts among large log volumes.
- Supports prioritizing handling during shifts.
- Improves personal monitoring efficiency, helping Tier 1 easily manage and review selected events.
Mark as Read
This feature allows marking one or multiple events as "Read".
After execution, these events will no longer display when users select "Show Unread Only" mode.
- Helps manage event processing status clearly, distinguishing between viewed and unviewed events.
- Supports reducing information noise, only displaying new or unprocessed events.
- Improves shift work efficiency, helping other Tier 1 easily grasp processing progress.
- Contributes to maintaining organized monitoring process, avoiding omissions or duplications in event tracking.
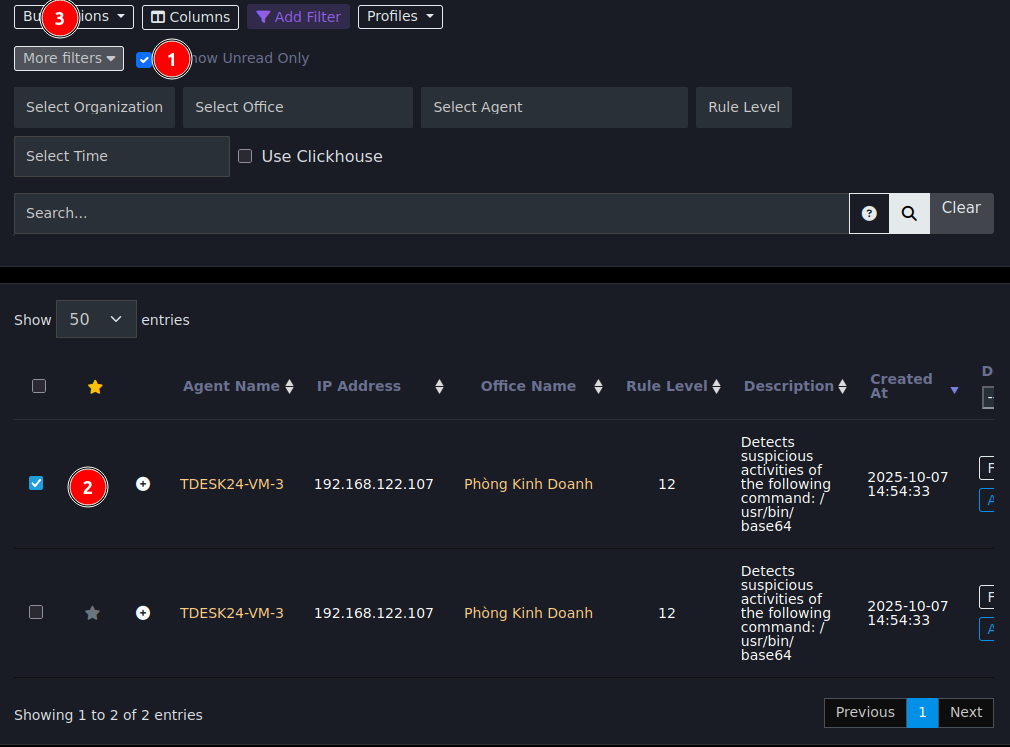
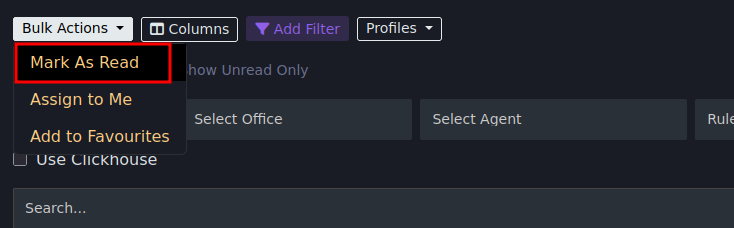
Steps to perform as shown in the 2 images above
Assign to Me
This is a feature to assign one or multiple events to yourself, to inform other members that the event already has someone responsible for investigation.
- Helps avoid duplication in event handling process among Tier 1 personnel.
- Increases transparency and coordination in the monitoring group.
- Supports tracking event handling progress, knowing clearly which event has someone assigned.
- Contributes to standardizing work procedures in SOC, especially when there are multiple shifts or parallel operating groups.
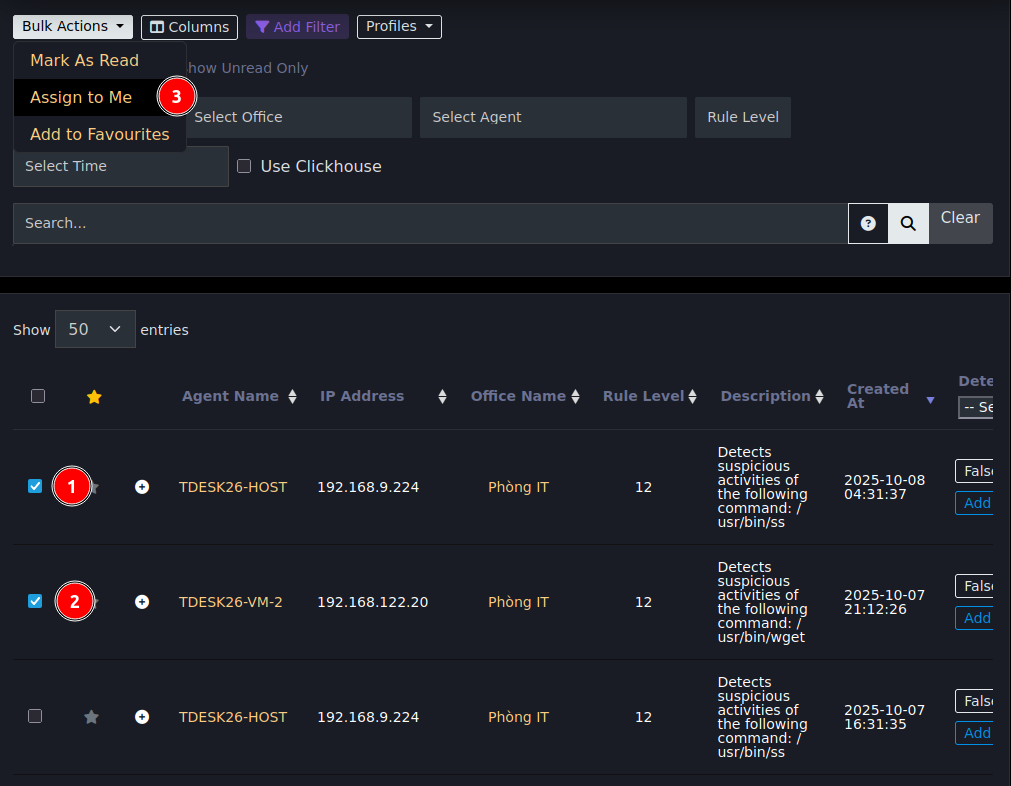

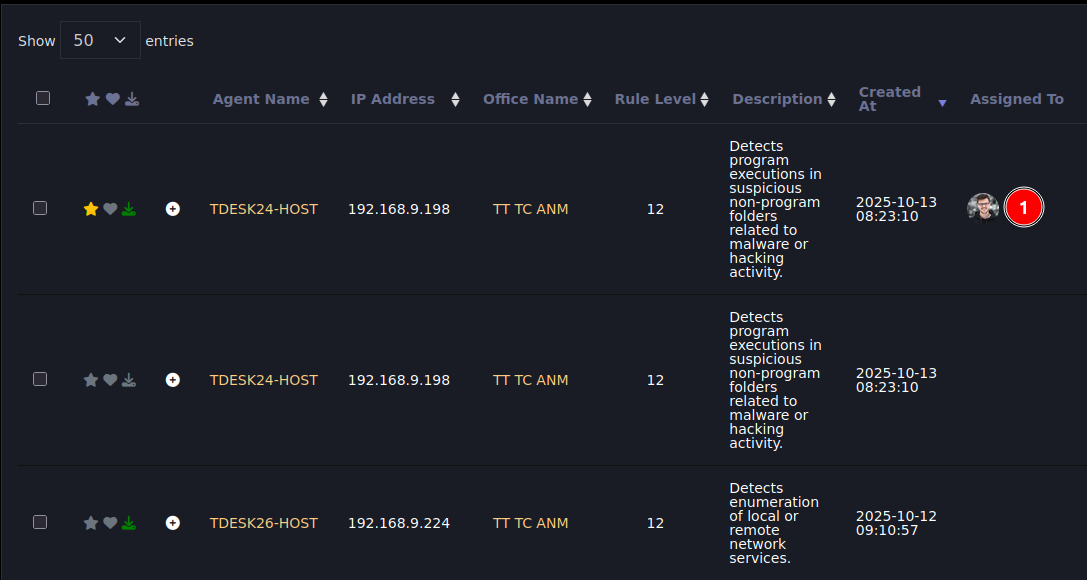
Add Event to Favorites
This feature helps users save events they find useful and keep them for reference in future investigations.
Method 1
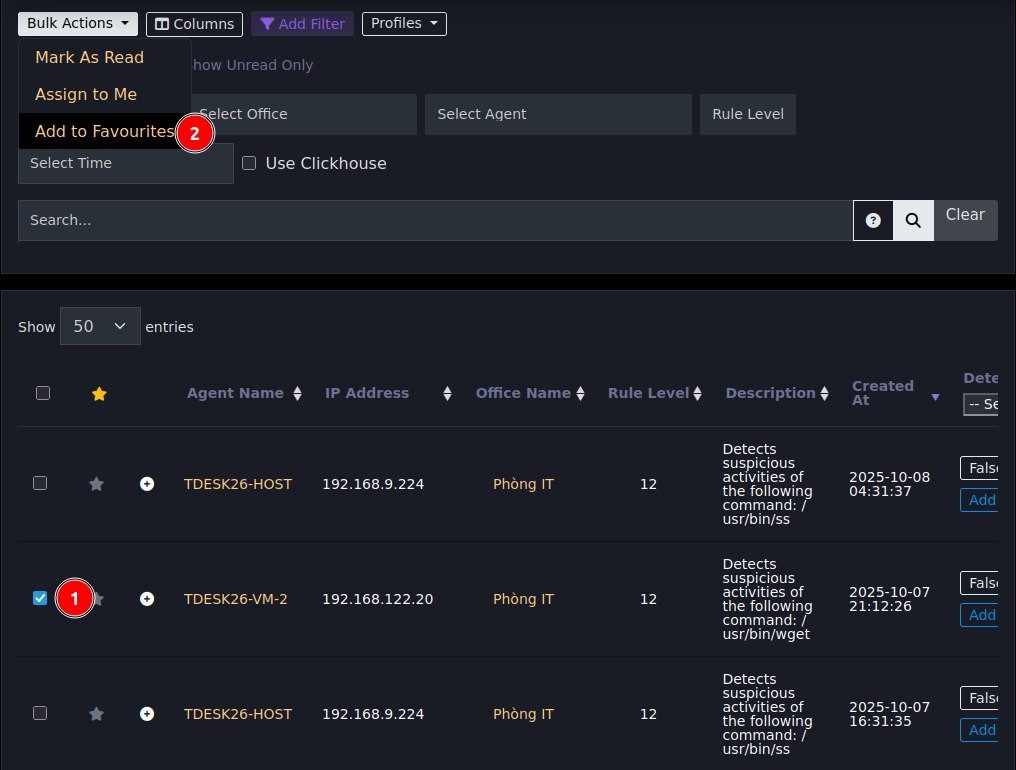
Method 2


Events saved to favorites will display in the Like Event tab of My Events page. Example as shown below

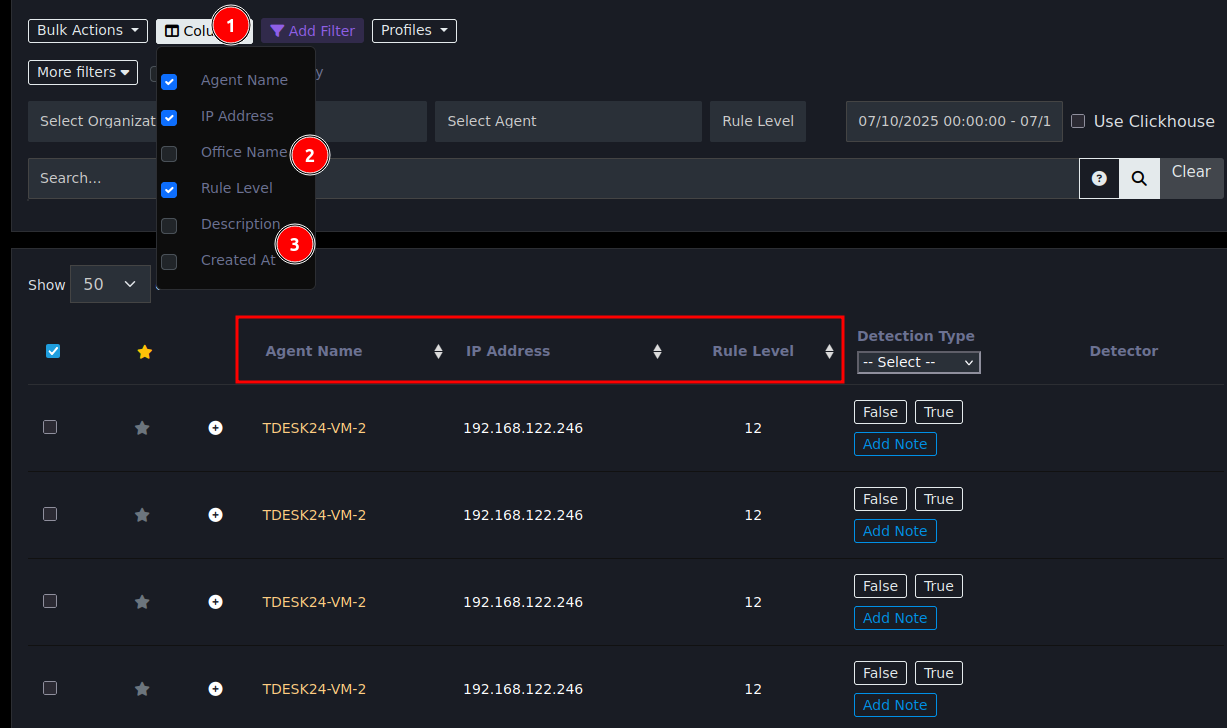
Select Columns
This feature allows users to show/hide columns in the event list table
Save Profiles
This feature allows users to save event filter configuration by fields such as Organization, Office, Agent, Rule Level, Time.
Thus, when needing to reuse, users only need to select saved Profile, the system will automatically fill in filter information into corresponding fields and columns — helping save time.
- Helps save lookup and data filtering time, especially with frequently used filters.
- Improves work efficiency, reducing repetitive operations during log investigation or event monitoring.
- Supports standardizing event filtering procedures, helping multiple Tier 1 use the same search configuration.
- Enhances consistency and accuracy in analysis, log retrieval according to preset criteria.

Follow the steps in order to save profile

Select one of the profiles to reload corresponding saved filter
Minimum Severity
This feature is used to filter events by minimum severity level (rule level) based on selected value, ranging from selected value to highest level 15.
Required condition: Must enable Noise Mode.
Example: Select Minimum Severity = 10 → system displays events with rule level from 10 to 15.
- Helps quickly filter important events, reducing noise from low-level logs.
- Supports focusing on high-risk events, improving monitoring efficiency.
- Optimizes displayed information volume, especially in Noise Mode when many events are continuously generated.
- Helps Tier 1 prioritize handling correctly, avoiding missing high-severity events.

Noise Patterns (Noise Reduction Keyword Input)
This feature is used to eliminate events containing keywords or character strings matching the pattern entered in the input field.
Required condition: Must enable Noise Mode for this feature to work.
- Helps quickly eliminate noisy or unimportant logs, focusing on events with high investigation value.
- Supports optimizing monitoring interface, reducing unnecessary displayed event count.
- Speeds up analysis and incident handling, avoiding being distracted by repetitive or unrelated events.
- Contributes to improving accuracy when monitoring in real-time in high-density log environments.
Sensor Tag / Agent Tag
The 2 features listed above in Asset Management section help users search for events filtered by sensor/agent tag

Show Unread Only
This feature allows only displaying events that have not been marked as "Read", helping users focus on new or unprocessed events.
