Netflows Dashboard
Netflows Dashboard
Network Visualization Dashboard Monitoring System
Purpose
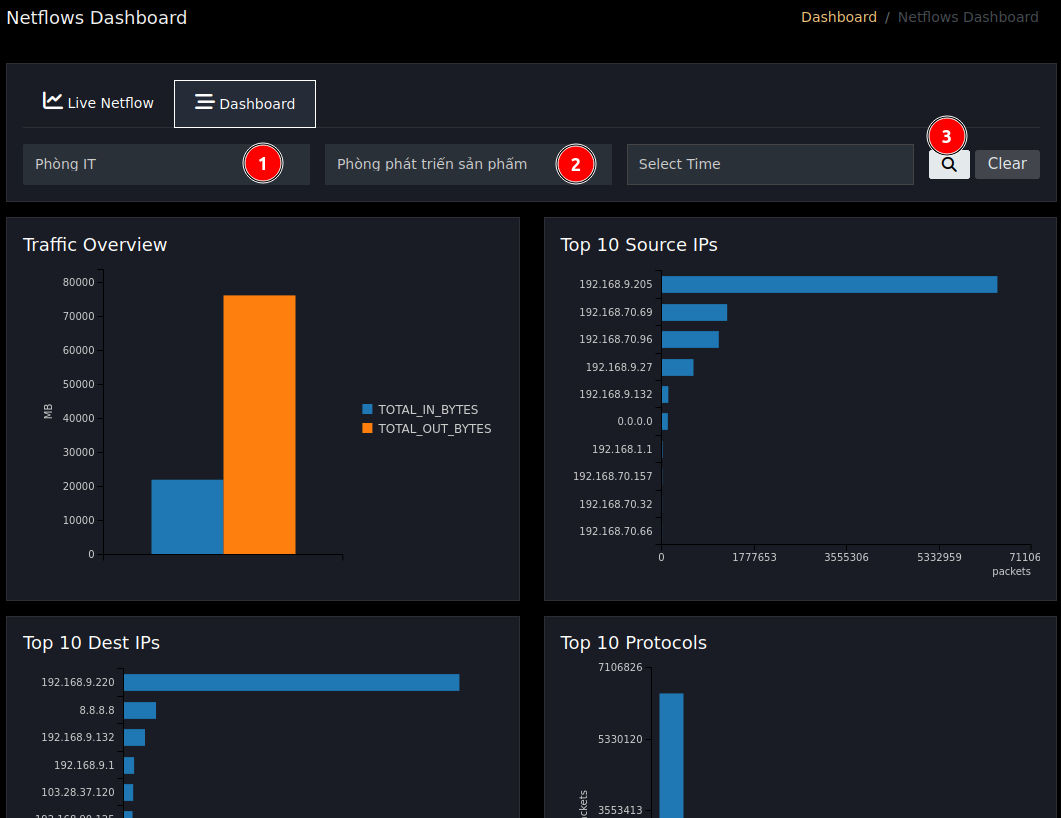
This feature provides a centralized network data visualization interface, helping administrators grasp the overall picture and details of network operational status at each Office in real-time. Through analysis of metrics about traffic, protocols, and anomaly indicators, this feature serves as the first monitoring layer to:
- Overall Management: Monitor data turnover (In/Out) and network traffic structure across the entire system.
- Performance & Reliability Monitoring: Control metrics about latency, protocol errors (HTTP errors), and encryption rate (SSL usage) to ensure service quality.
- Early Risk Detection: Quickly identify abnormal behaviors, sudden traffic spikes, or suspicious IPs through source/destination analysis and geolocation.
- Incident Response Optimization: Provide visual indicators supporting Tier 1 team to perform initial investigation, quickly identify incident origin and direction, thereby reducing MTTR and improving decision-making efficiency.
Included Charts
- Traffic Overview: total traffic in/out overview
- Top 10 Source IPs: Top 10 source IPs with highest packet volume
- Top 10 Dest IPs: Top 10 destination IPs with highest packet volume
- Top 10 Protocols: Top 10 protocols with highest packet volume
- Top HTTP Errors: Top HTTP errors with highest packet volume
- Top Network Latency: Top network latency
- SSL Usages: SSL usage rate
- Top 10 Geolocation: Top locations with highest packet volume
- Top 10 Anomalies: Top 10 anomalous traffic